[Update: It was brought to my attention that these cyclist and pedestrian counts took place in October. Why did the City use October numbers instead of dates more representative of good cycling and walking weather? The Bicycle Cordon Count the City did last year were specifically conducted in September because it is an optimal time to count cyclists. People are back from vacation and it is still good weather for cycling. October is getting late and is not representative of peak demand.]
[Update #2: I also noticed that this 2% is suspiciously similar to the average bike mode share for the entire City of Toronto, which includes the suburbs, and seems to be lower than the average bike mode share for downtown. In a census map of the bike mode share across Toronto, for the area that includes John Street north of Queen, the bike mode share is between 4% and 10% and south of Queen is between 1 and 4%.]
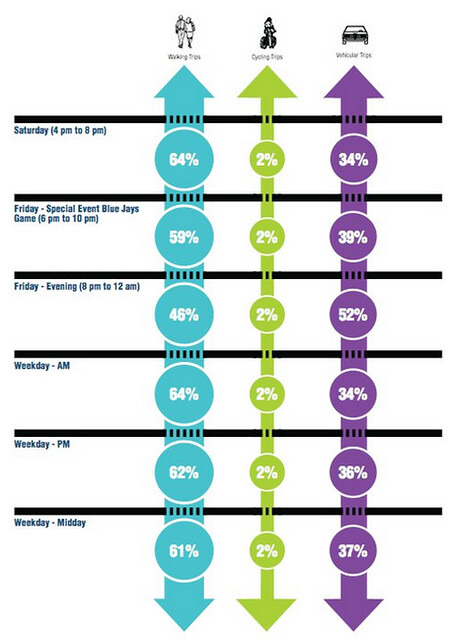
In this second post of three on John Street and its importance for the protected bike lane network proposed by Councillor Minnan-Wong and the Bike Union, I look at some number fudging (see first post). Dave Meslin points out some interesting fudging in the report presented for improving John Street streetscape. Is it a reflection of laziness or did someone attempt to make it seem like the cycling mode share on John Street is smaller than it actually is? Take a look at these two images. In the first is a diagram from the John Street Report, showing the percentage of mode share over the day:
 ©Percentage mode share on John Street
In the report along the top they say "Walking trips currently make up about 60% of the total trips along John St. corridor on average and cycling and vehicular trips make up 2% and 40% respectively." That makes sense, but then the vertical graph the percentages of pedestrian and car trips fluctuate throughout the day whereas cycling stays at 2%. Why did they continue to use the average mode share for cycling but used more timely numbers for the other two?
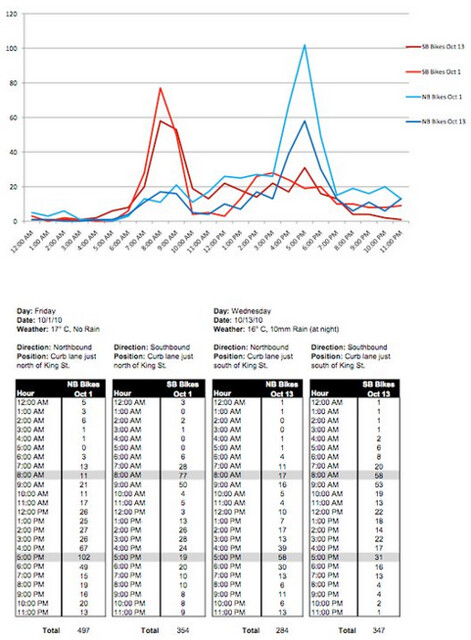
Take a look at the following image of the actual bike counts at King and John. The numbers fluctuate greatly, but even if the bike counts were the same at midnight and at noon (very unlikely), it still wouldn't produce a 2% mode share at all times of day since pedestrian and car counts would fluctuate.
As Dave Meslin stated on Facebook:
These are the numbers presented by the "John Corridor Environmental Assessment Study". Why do these numbers show 2% for cyclists all day, when we know that cyclist numbers fluctuate and go as high as 120 per hour? If 100 cyclists represents only 2%, that would mean that there are 1,800 pedestrians per hour and over 3,000 cars? On John Street?
The second public meeting for the project will be taking place Thursday, June 16, 2011, 6:30 - 8:30 p.m. Room 309, Metro Hall, 55 John Street. Please come out to comment on John Street and ask how proper planning can take place without proper numbers and reporting.
We commend Councillor Vaughan for this city beautification project. We just believe that there is room for cyclists in the project and can be accommodated so we can have a complete bikeway network.


Comments
Ed
It's kind of hard to read
Fri, 06/10/2011 - 16:33It's kind of hard to read those numbers on flickr, even with all the magnification I can figure out.
It looks like 24-hour counts on a weekday are between about 250 and 500 cyclists.
8 hour pedestrian counts at John and various intersections range between 5600 and 20,000. Mind you, I expect that a major part of the count is people on the cross-street. The pedestrian counts are in the third column.
1461 8/20/2009 20656 QUEEN ST W JOHN ST
1417 4/23/2009 18295 FRONT ST W JOHN ST PRIVATE ACCESS
1489 4/23/2009 12944 WELLINGTON ST W JOHN ST
1320 6/25/2007 10304 KING ST W JOHN ST
269 3/2/2009 5692 RICHMOND ST W JOHN ST
1090 8/1/2007 5686 ADELAIDE ST W JOHN ST
Also keep in mind that we're comparing 8 hours of pedestrians and I wonder if that catches the evening party crowds wandering about.
No, I don't know the methodology. You can poke around yourself on the pedestrian count page.
This does suggest that bicycles are a small minority of John Street users, most likely less than 10% of the number of pedestrians. Mind you, that would put the bike share at 4% or 5% instead of 2%.
Do they have "projected usage" numbers after any changes?
Antony (not verified)
Well, Dave Meslin and some
Wed, 06/15/2011 - 14:26Well, Dave Meslin and some volunteers went out and did a count.
Turns out that yesterday's average bicycling mode share in the morning rush-hour was 32%, counted on southbound John at Richmond.
John north of Queen has obviously higher bicycle counts - 50% of traffic from 7:30-9:30.
The city's "2%" numbers seem less and less credible every day.